Containers metrics with Prometheus and Grafana

When we use micro service architecture, we use lots of docker container. So we need to monitor all the containers metrics such as memory, I/O, cpu and etc.
1. What is Prometheus?
- Prometheus is an open-source systems monitoring and alerting toolkit originally built at SoundCloud.
- The main Prometheus server which scrapes and stores time series data.
- Prometheus is designed for reliability, to be the system you go to during an outage to allow you to quickly diagnose problems.
- Prometheus is using its own query language called PromQL.
2. What is Grafana?
- Grafana is a multi-platform open source analytics and interactive visualization software.
- It provides charts, graphs, and alerts for the web when connected to supported data sources.
3. Prometheus + Grafana
- Grafana supports querying Prometheus.
- The Grafana data source for Prometheus is included since Grafana 2.5.0.
4. Exporters
Prometheus exporter exposing container metrics as prometheus metrics.
Some of these exporters are maintained as part of the official Prometheus GitHub organization, those are marked as official, others are externally contributed and maintained.
5. CAdvisor
cAdvisor (Container Advisor) provides the resource usage and performance characteristics of their running containers such as memory, cpu and etc.
It is a running daemon that collects, aggregates, processes, and exports information about running containers.
The container-exporter requests a list of containers running on the host by talking to a container manager.
Earlier, We used prom/container-exporter to get container metrics. This is deprecated. 6. Setup the Environment
Here I am using Prometheus, Grafana and CAdvisor.
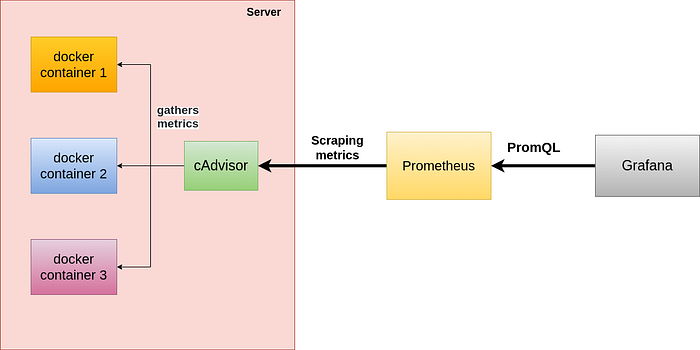
I am using rest api and postgres docker containers which I used earlier. If you need to use those containers please check this link.
Here, I am using docker compose to run all the docker containers. docker compose is a tool for defining and running multi-container Docker applications.
You can run a single cAdvisor to monitor the whole machine. So according to the below image, we must run one cadvisor container on every machine.

1. cadvisor
This is the docker compose file for cadvisor. 8080 is the default port of cadvisor.
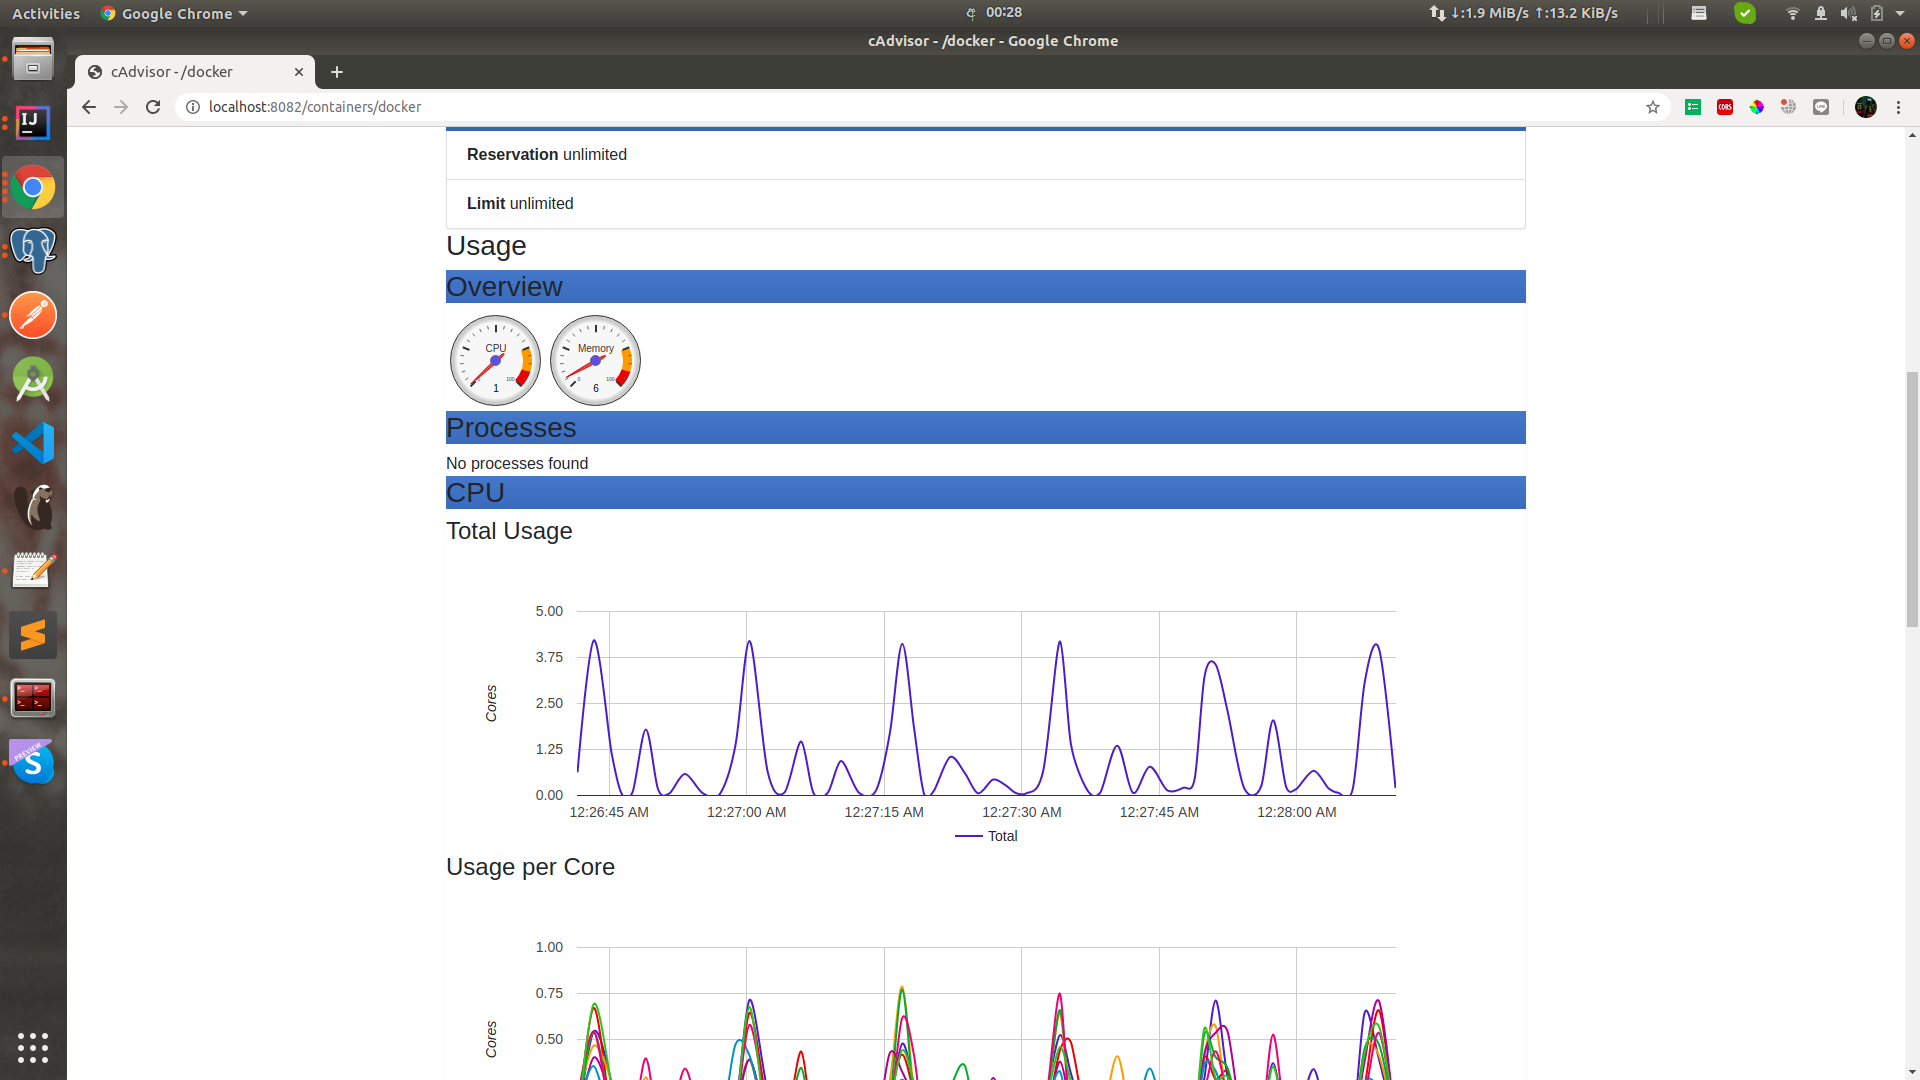
docker-compose upcAdvisor has exposed a web UI at its port(8080).
link- http://localhost:8082/
Important- Here I am using http://localhost:8082/ because I have added port forwarding for 8080.

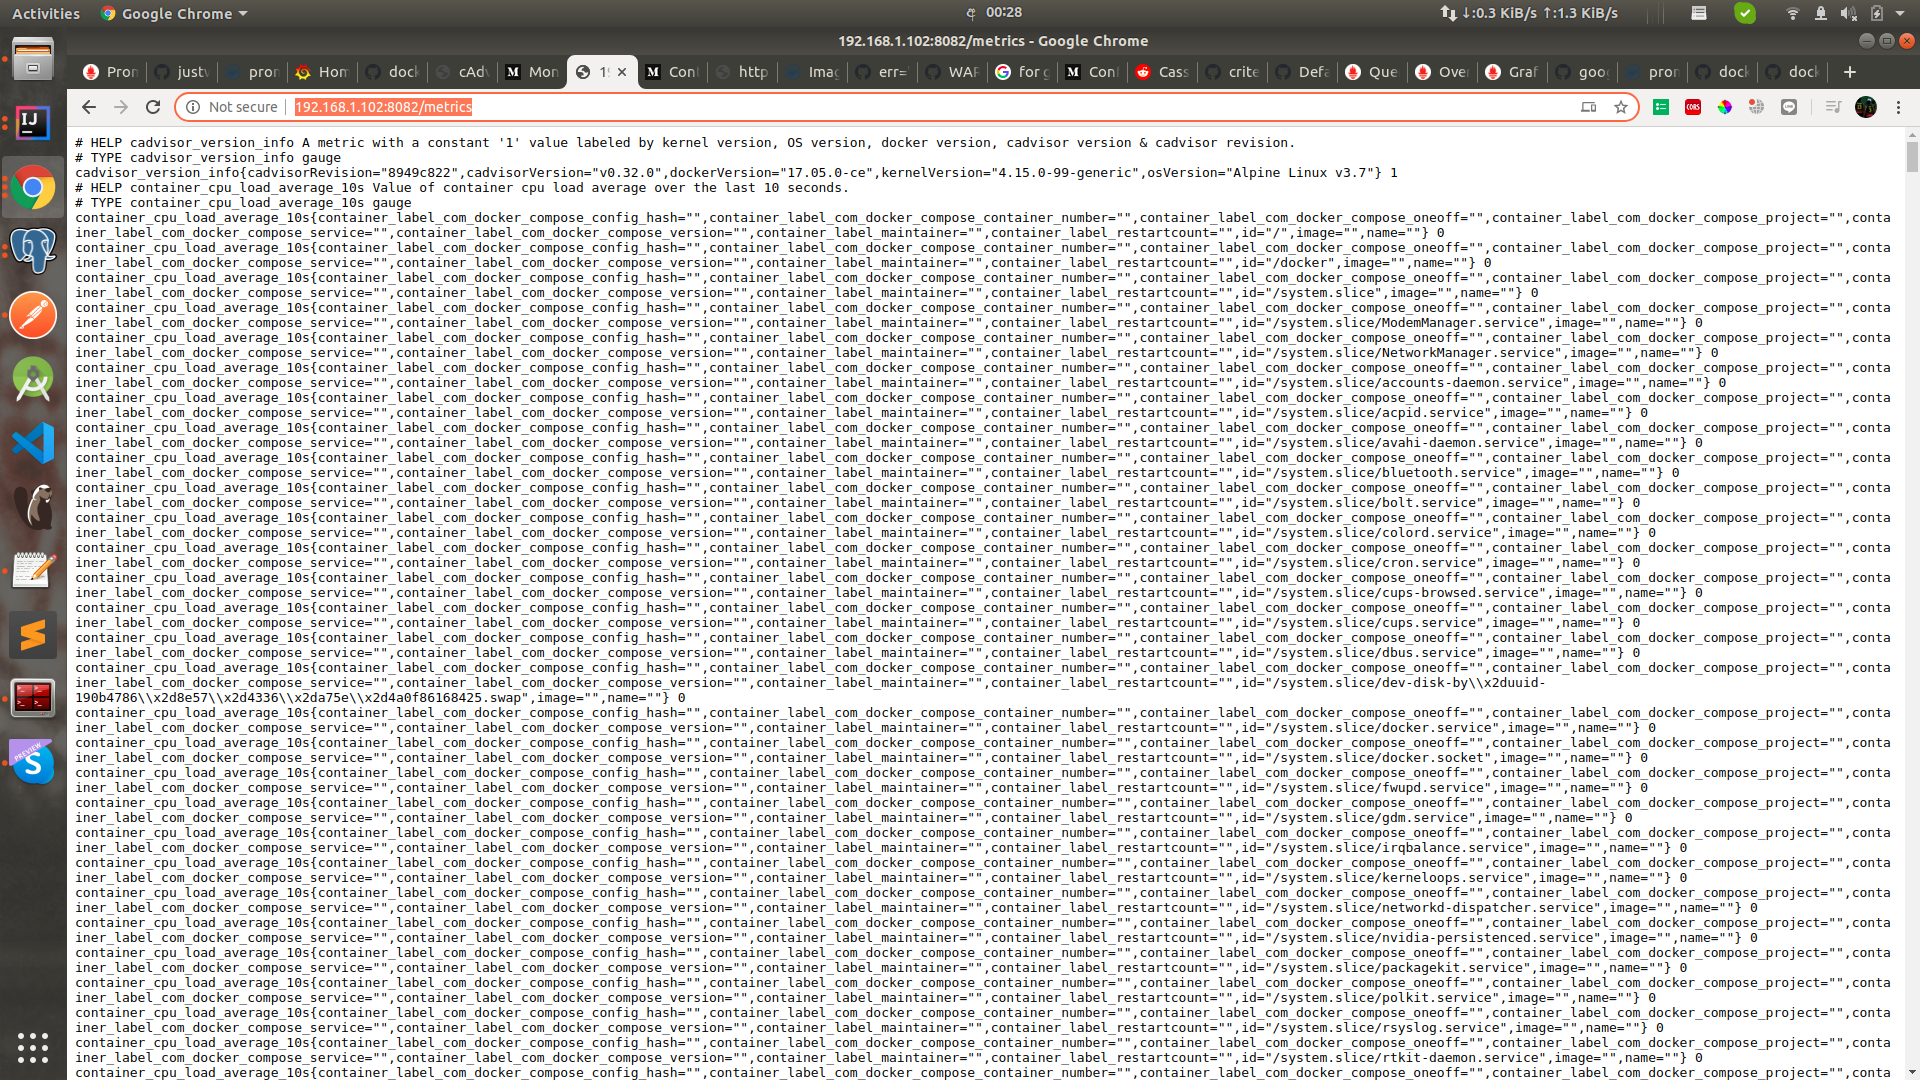
when we got to http://<MACHINE_IP>:8082/metrics , we can see, cAdvisor is exposing some metrics.
2. Prometheus
- In here, I am using prometheus.yml to add my own custom configurations. Using this config file, I have added targets of scrape_configs for cadvisor and default prometheus metrics.
- scrape_interval is 5 second. So every 5 second, prometheus is going to scrape metrics.
- According to below config, prometheus knows which metrics it is going to scrape.
i) cAdvisor target- <MACHINE_IP>:8082 (default port is 8080, port forwarding 8082)
ii) prometheus target- <MACHINE_IP>:9090
This is the docker compose file for prometheus. 9090 is the prometheus default port.
docker-compose upThis is the prometheus UI.
link- http://localhost:9090/

3. Grafana
This is the docker compose file for grafana. Here I have overridden admin password using GF_SECURITY_ADMIN_PASSWORD= pass. 3000 is the default grafana port.
link- http://localhost:3000/

According to below image, there is a data source type for prometheus. So we should add it as a data source.

This is the docker compose file including cadvisor, prometheus and grafana.
Below image is displayed, all the docker container are up and running.

4. Container memory
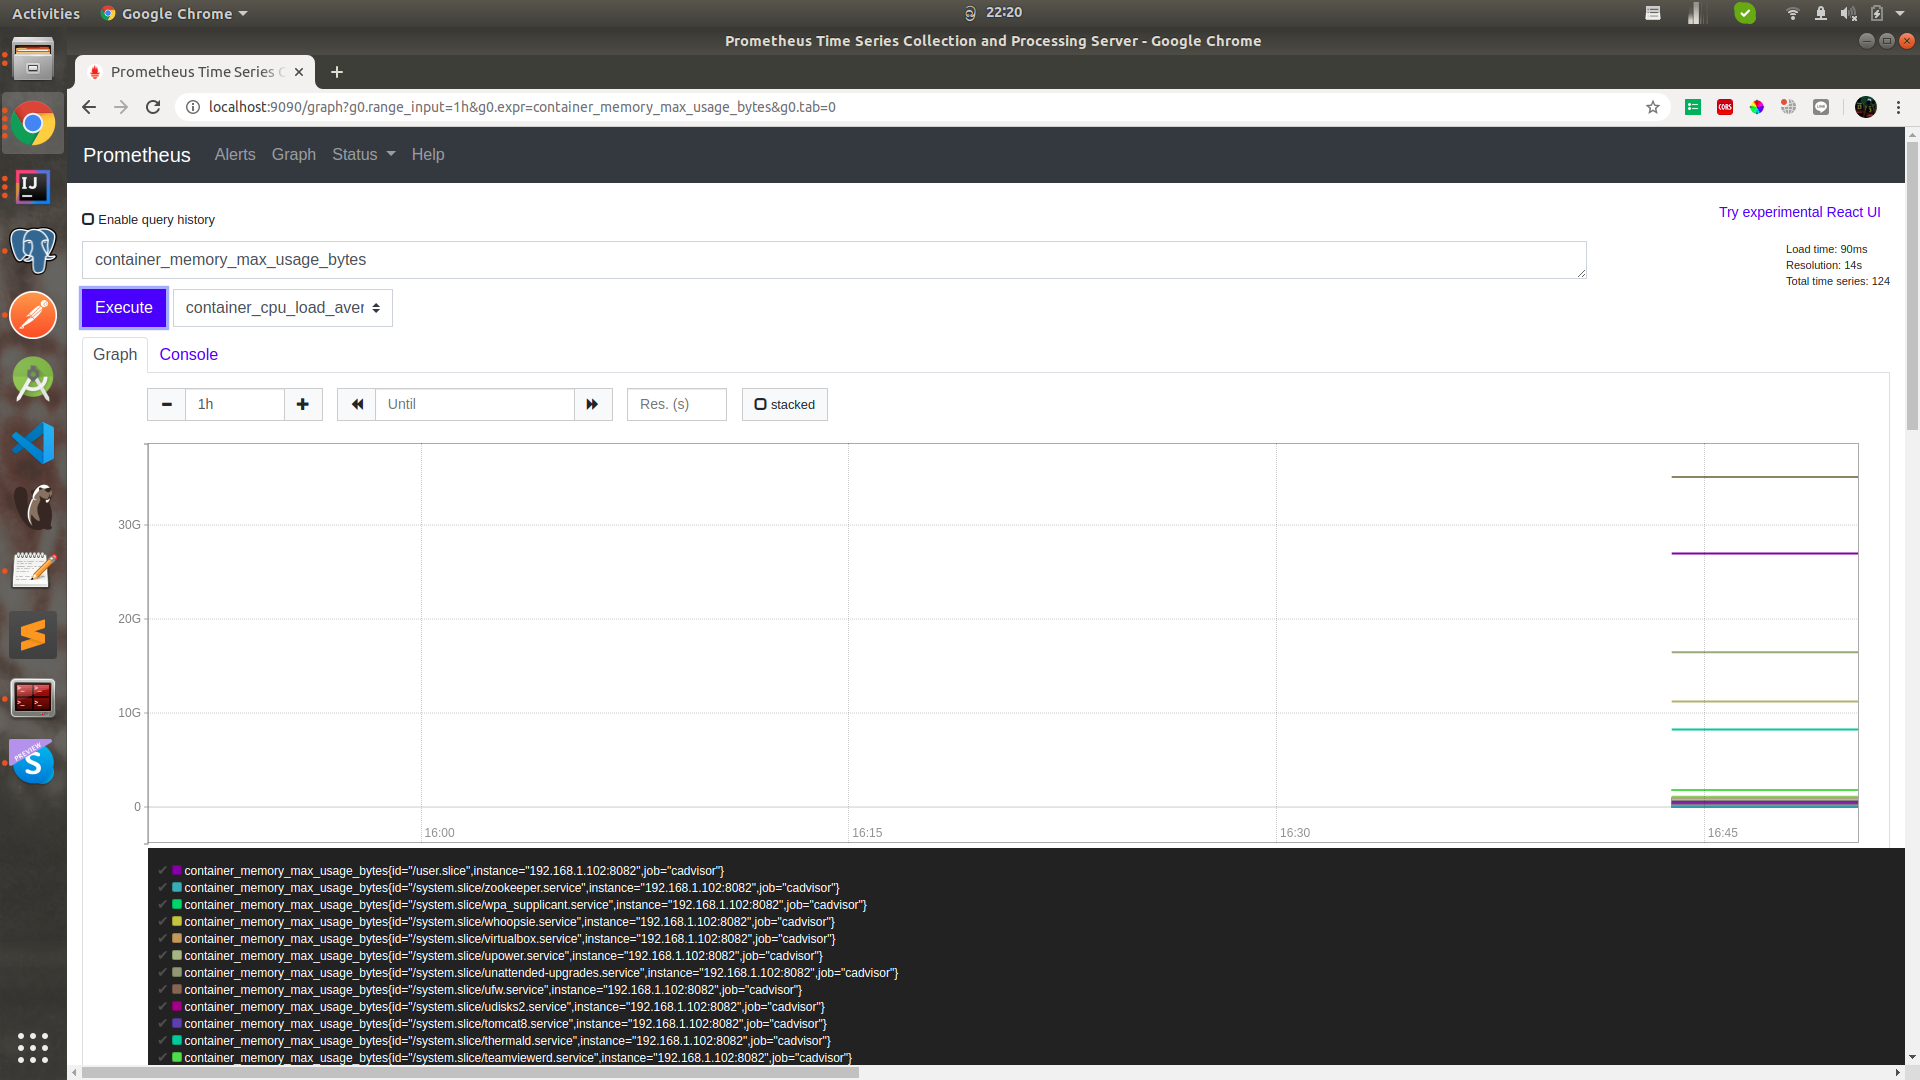
This is how we query container memory on Prometheus. There are lots of metrics related to memory usage.

We can draw a graph also using those metrics on Prometheus.
This is the Grafana dashboard for CPU metrics.

5. Conainer CPU
This is how we query container cpu on Prometheus. There are lots of metrics related to cpu usage.

We can draw a graph also using those metrics on Prometheus.

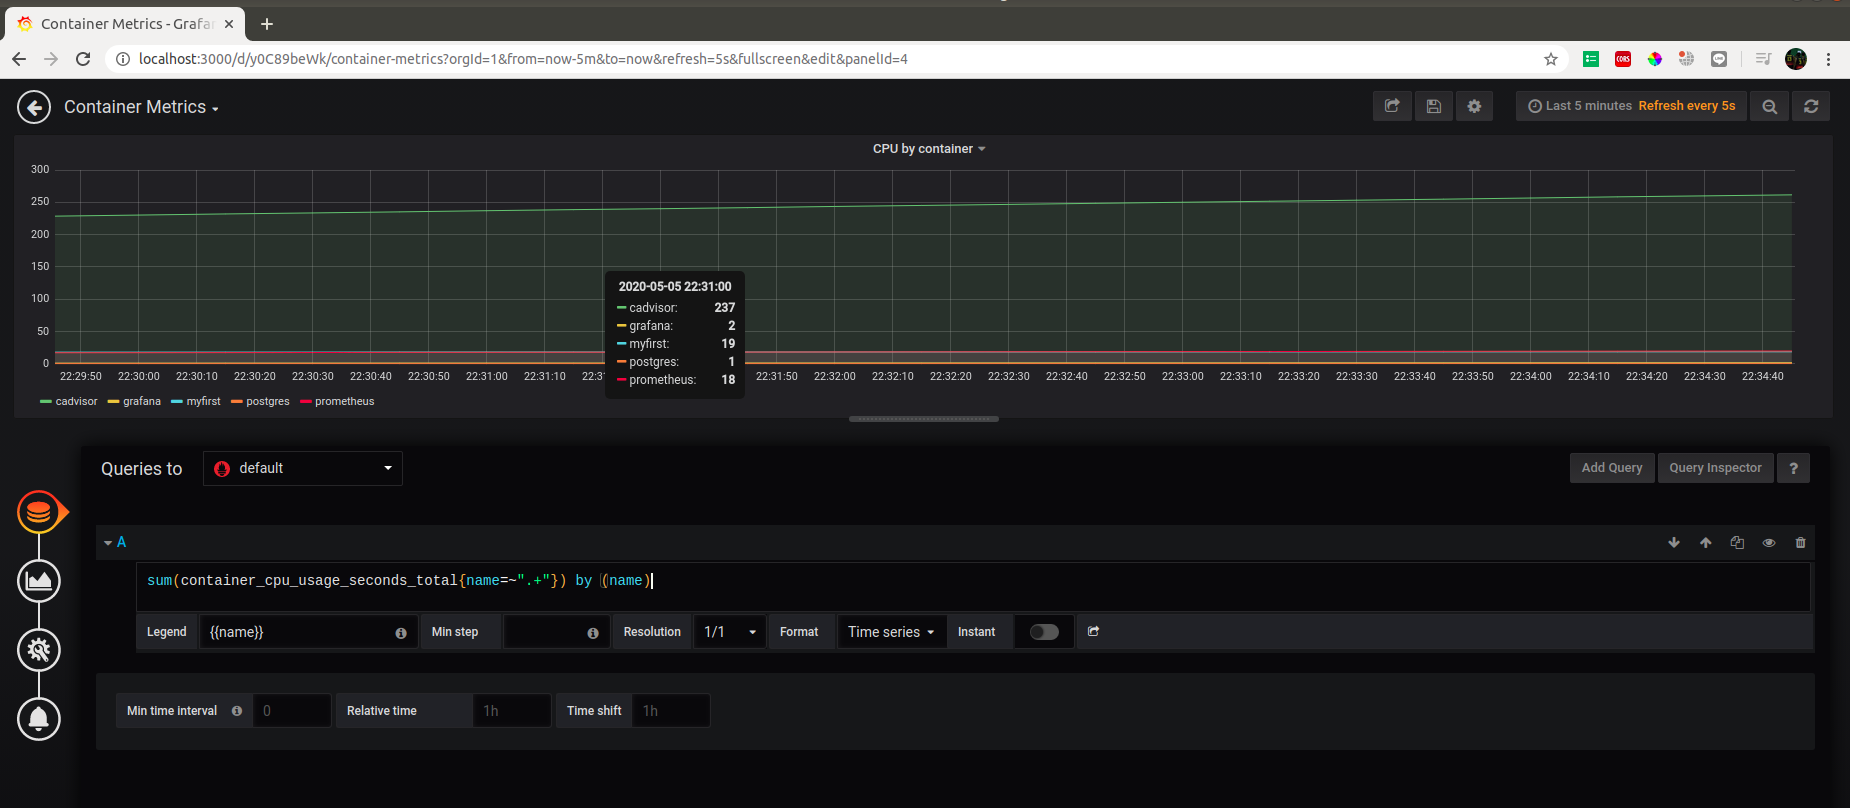
This is the Grafana dashboard for CPU metrics.
6. Container I/O metrics


